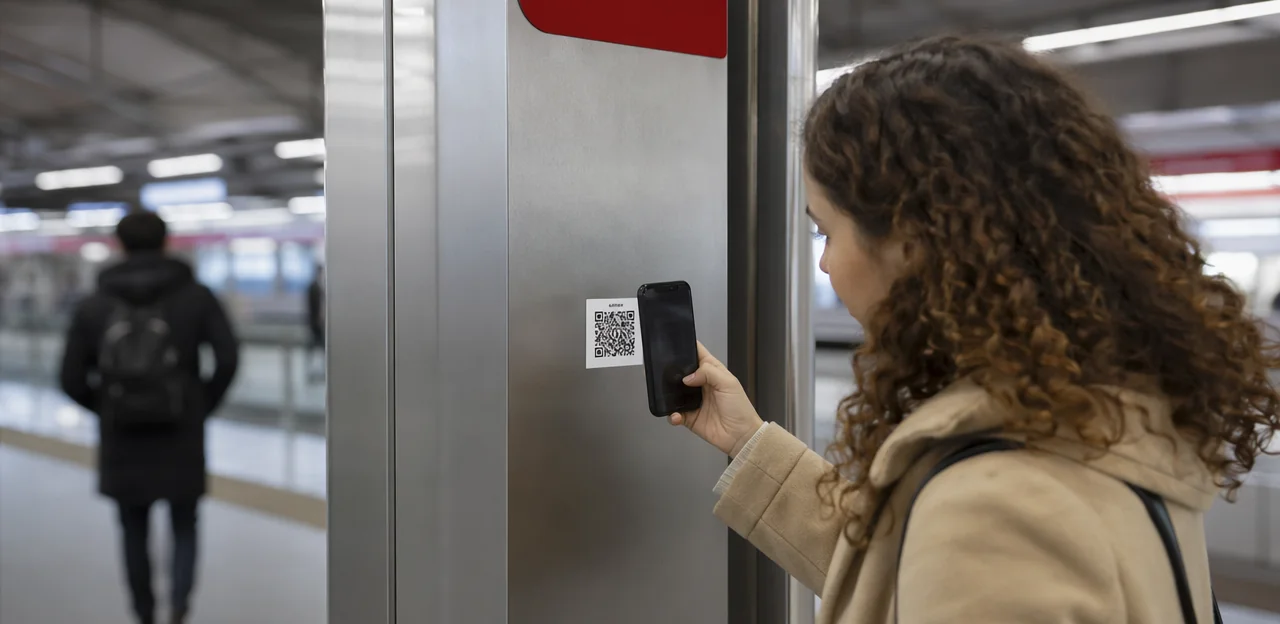
A late arrival, a missed doorstep instruction, a damaged package, an unfriendly handoff—small delivery issues rarely stay small in the eyes of customers. In home delivery, friction happens at the route level, where traffic patterns, driver workloads, fulfillment timing, and neighborhood-specific challenges can quietly erode service quality. That is why delivery teams need more than top-line satisfaction scores. They need delivery feedback by route to uncover where problems repeat, why they happen, and how to fix them before they become costly patterns.
This article explores how route-level feedback helps operators move from reactive troubleshooting to proactive improvement. We’ll look at the types of signals that reveal operational friction, how to separate route issues from product or service issues, and why fast post-delivery insight is essential for protecting the delivery experience and overall customer experience. We’ll also cover how businesses can use tools such as receipt, packaging, or QR-based feedback collection—sometimes through solutions like Tapsy—to capture timely insights and trigger faster service recovery. By the end, you’ll understand how route-specific feedback can sharpen operations, improve accountability, and create a smoother, more reliable home delivery journey.
Why route-level feedback matters in home delivery

What delivery feedback by route actually means
Delivery feedback by route means tying customer responses to the specific route, stop sequence, driver run, or delivery window that served them. Instead of viewing all home delivery feedback as one blended score, operations teams can see where friction actually happens.
This differs from broad post-delivery surveys or overall satisfaction reporting because those views often show what customers felt, but not where the problem occurred.
- General surveys summarize brand-level satisfaction
- Route-level delivery feedback connects complaints and praise to a route, territory, or time slot
- It helps leaders spot repeat issues like late arrivals, damaged orders, poor handoffs, or routing inefficiencies
That route-level visibility is more actionable because teams can fix specific operational causes faster, rather than guessing from high-level averages.
How route data exposes operational friction
Using delivery feedback by route turns scattered complaints into a clear operational map. When feedback is grouped at the route level, teams can spot patterns that single-order reviews often hide, making operational friction in delivery easier to diagnose and fix.
- Missed windows: Repeated late-arrival complaints on the same route may point to unrealistic scheduling, traffic blind spots, or overloaded stops.
- Poor communication: If customers on one route report missing ETA updates, the issue may be a process gap rather than an isolated mistake.
- Damaged goods or difficult handoffs: Clustered feedback can reveal packaging, handling, or access-related delivery route issues.
- Driver-specific breakdowns: Route-level trends help separate network-wide delivery experience problems from coaching or staffing needs.
Tools like Tapsy can help teams compare route feedback quickly and trigger faster recovery.
The link between route performance and customer experience
In home delivery, route performance directly shapes the customer experience. When a route consistently runs late, misses delivery windows, or produces damaged orders, customers do not separate logistics from the brand—they judge the entire delivery experience accordingly.
Key route-level impacts include:
- On-time, accurate routes build satisfaction and trust.
- Unreliable routes increase complaints, refund requests, and support costs.
- Repeated route issues reduce confidence and lower repeat purchases.
- Driver- and area-specific patterns reveal where service recovery is needed fastest.
Using delivery feedback by route helps teams connect operational friction to real customer outcomes. Track feedback alongside delay rates, failed deliveries, and handoff quality to spot problem routes early. Tools like Tapsy can help capture post-delivery feedback quickly and turn route insights into action.
Common sources of friction revealed by route feedback
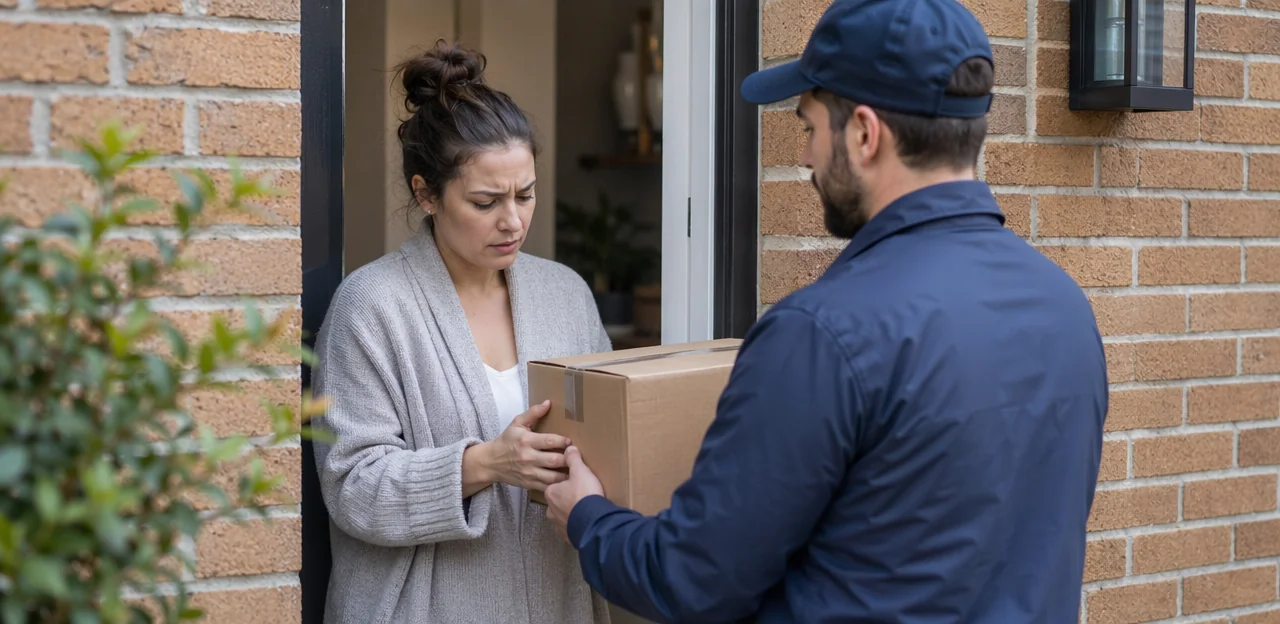
Scheduling, capacity, and routing problems
Many recurring service failures start with planning, not execution. Delivery feedback by route often reveals that delivery routing problems come from unrealistic stop counts, tight time windows, and poorly drawn territories. When drivers are set up to fail, delays, missed ETAs, and failed deliveries become predictable.
- Unrealistic route planning: Too many stops or inaccurate drive-time assumptions create late arrivals and rushed handoffs.
- Overloaded schedules: Stacked routes leave no buffer for traffic, parking, building access, or customer availability.
- Poor territory design: Inefficient zones increase mileage, driver fatigue, and missed delivery windows.
Use route optimization feedback to compare complaints by route, shift, and area. Track patterns such as “late delivery” or “could not deliver” to pinpoint delivery scheduling issues and rebalance capacity before customer sentiment declines.
Communication gaps during the delivery journey
A delivery can arrive on time and still leave a negative impression if delivery communication breaks down. Customers judge the full experience, not just the final handoff. Common friction points include:
- Missing customer delivery updates: Long silence after dispatch makes customers unsure whether the order is moving, delayed, or lost.
- Poor ETA accuracy: Inaccurate time windows disrupt schedules and reduce trust, especially when customers wait at home unnecessarily.
- Unclear arrival messaging: Vague “arriving soon” alerts do not help customers prepare for handoff, gate access, or missed deliveries.
To improve, track delivery feedback by route alongside notification timing, ETA performance, and arrival-message clarity. This helps teams identify which routes, drivers, or time windows create repeated frustration. Tools like Tapsy can help capture fresh post-delivery feedback and surface communication issues quickly.
Driver execution and doorstep experience issues
Driver behavior often shapes the customer’s final impression more than delivery speed alone. When reviewing delivery feedback by route, teams should isolate execution issues that damage trust and repeat purchase intent:
- Professionalism: Track punctuality, courtesy, communication, and appearance. Strong driver performance feedback helps identify routes where rushed or inconsistent interactions lower satisfaction.
- Proof of delivery issues: Missing photos, inaccurate timestamps, or unclear handoff records can trigger disputes and weaken accountability. Standardized proof requirements reduce avoidable complaints.
- Handling quality: Damaged packaging, careless placement, or ignored instructions directly hurt the doorstep experience and brand perception.
- Service expectation adherence: Compare route-level feedback against promises like contactless drop-off, delivery windows, and special instructions.
Tools like Tapsy can help capture fresh post-delivery feedback and flag recurring route problems quickly.
How to collect and organize delivery feedback by route

Best channels for gathering actionable feedback
To improve delivery feedback by route, use a mix of fast, low-friction customer feedback channels and operational data sources. The best options include:
- SMS surveys: Ideal within 30–60 minutes of drop-off. Short links and 1–2 questions increase response rates and make delivery feedback collection more immediate.
- Email follow-ups: Best for same-day or next-day outreach when you want slightly richer comments in a post-delivery survey.
- App prompts: Trigger feedback right after order completion for high-intent responses while the experience is still fresh.
- Call center logs: Capture recurring route issues, such as late arrivals, missed handoffs, or damaged items.
- Support tickets: Useful for identifying friction patterns by route, driver, or delivery window.
For stronger insights, standardize issue categories and time feedback requests carefully. Tools like Tapsy can also help capture real-time post-delivery input.
Tagging feedback to routes, stops, and drivers
To make delivery feedback by route useful, structure every response with consistent operational identifiers. Each survey or QR/NFC submission should automatically capture:
- Route ID for route-level data comparisons
- Delivery stop ID for precise delivery stop analysis
- Driver or crew ID to build reliable driver feedback data
- Promised time window and actual delivery timestamp
- Service type such as same-day, scheduled, grocery, or white-glove
Use your order management or dispatch system to pass these fields into the feedback record at the moment of delivery. Standardize naming conventions so route and driver records match across systems. Then segment results by route, stop density, geography, and time window to spot repeat friction, such as late arrivals, missed handoffs, or service-type-specific issues. Tools like Tapsy can help capture and route this data in real time.
Combining qualitative comments with operational metrics
To make delivery feedback by route truly useful, combine verbatim customer input with core operational delivery metrics. This turns isolated complaints into clear, route-level patterns and stronger delivery analytics.
- Match comments to on-time delivery: Late-delivery remarks gain meaning when viewed alongside actual on-time percentages by route and time window.
- Compare failed delivery rate with themes: If customers mention missed handoffs, unclear instructions, or no-show attempts, check whether failed delivery rates are elevated on the same route.
- Layer in dwell time: Comments about rushed service or long waits often align with unusually high or low stop dwell time.
- Track contact rate: Frequent driver-customer calls can signal hard-to-find addresses, poor routing, or communication gaps.
Strong customer comments analysis helps teams separate one-off issues from repeat friction. Tools like Tapsy can help capture fresh post-delivery comments and connect them to route performance trends.
How to analyze route feedback for patterns and root causes

Spotting trends across routes and regions
To turn delivery feedback by route into action, compare performance across consistent operational slices. Strong route analysis helps teams see whether friction is isolated or systemic.
- By geography: Map feedback by postcode, neighborhood, or urban vs. suburban zones to uncover gaps in regional delivery performance.
- By daypart: Compare morning, afternoon, and evening windows to spot congestion, staffing, or handoff issues.
- By product type: Separate groceries, fragile goods, meal kits, or bulky items to identify handling-related complaints.
- By service level: Review same-day, scheduled, and premium deliveries separately to find where expectations are missed most.
Prioritize routes with both high complaint volume and high business value. Track recurring issues weekly to confirm delivery trends and direct coaching, routing changes, or recovery efforts where urgency is highest.
Separating one-off complaints from systemic issues
To turn delivery feedback by route into action, separate isolated incidents from repeatable failures. A single complaint may reflect bad luck; repeated signals point to systemic delivery issues that need root cause analysis.
- Check frequency: Review how often the same complaint appears on a route, stop cluster, driver shift, or time window.
- Measure severity: A rare but high-impact issue, like damaged goods or missed deliveries, may still require immediate escalation.
- Correlate with route metrics: Compare complaints against lateness, failed drop rates, dwell time, reroutes, proof-of-delivery gaps, and order accuracy.
- Look for patterns over time: Consistent delivery complaint patterns across multiple days or teams usually indicate process, training, or routing problems.
Tools like Tapsy can help teams capture fresh feedback and spot recurring route-level friction faster.
Building a route-level feedback dashboard
A strong route feedback dashboard should turn raw comments into clear operational action. Structure your delivery dashboard around views that help logistics, customer experience, and operations teams spot friction fast:
- Route summary view: show volume, average rating, complaint rate, on-time rate, and repeat issue categories by route.
- Exception view: highlight routes with spikes in late deliveries, damaged orders, missing items, or poor driver interactions.
- Time and geography view: compare feedback by daypart, delivery window, zone, depot, and driver cohort.
- Recovery view: track open issues, response time, resolution time, and recovered customers.
For effective delivery KPI tracking, prioritize:
- CSAT/NPS by route
- first-attempt success rate
- on-time delivery %
- issue rate per 100 deliveries
- refund or redelivery rate
This makes delivery feedback by route practical and actionable. Tools like Tapsy can help capture fresh post-delivery feedback in real time.
Turning route feedback into operational improvements
Fixing routing and service design issues
Use delivery feedback by route to spot where operational friction repeats and turn it into practical changes:
- Adjust route planning: If certain routes consistently trigger complaints about lateness, missed stops, or rushed handoffs, update stop sequencing, traffic assumptions, and driver load limits. This supports better route optimization.
- Rebalance territories: Compare feedback across zones to find overloaded areas, uneven driver density, or difficult delivery clusters. Redrawing territories can reduce delays and improve consistency.
- Refine time windows: Negative feedback tied to specific slots often signals weak time window management. Shorten overly ambitious windows, add buffer time, or offer fewer peak-period promises.
- Improve service promises: Align ETAs and delivery commitments with actual route performance, not ideal scenarios. This drives stronger delivery service improvement and builds customer trust.
Tools like Tapsy can help teams compare feedback by route and time window in real time.
Coaching drivers and frontline teams
Using delivery feedback by route helps managers coach with precision instead of relying on broad scorecards that hide recurring problems on specific runs, time windows, or neighborhoods. That makes driver coaching more fair, practical, and effective.
- Spot route-specific patterns: Identify whether low scores come from missed ETAs, damaged items, handoff issues, or communication gaps on certain routes.
- Target frontline delivery training: Use real customer comments to train drivers and dispatch teams on scanning, packaging checks, proof-of-delivery steps, and customer interactions.
- Recognize strong execution: Highlight drivers or crews consistently earning positive feedback on difficult routes to reinforce best practices.
- Improve delivery team performance: Pair route insights with ride-alongs, micro-training, and process updates rather than one-size-fits-all coaching.
Tools like Tapsy can help surface this route-level insight quickly.
Closing the loop with customers and internal stakeholders
Collecting delivery feedback by route only creates value when teams act on it. A strong customer feedback loop means customers hear back quickly, know their issue was logged, and see a clear resolution path. Internally, route-level patterns should be shared beyond support so operations, dispatch, driver management, and CX teams can fix root causes together.
- Respond fast: Acknowledge complaints, explain next steps, and recover service with refunds, credits, or replacements when needed.
- Share cross-team insights: Turn route trends into cross-functional delivery insights that highlight delays, missed handoffs, damaged orders, or driver communication issues.
- Assign ownership: Build delivery operations accountability by giving each route, region, or carrier manager clear metrics and follow-up actions.
Tools like Tapsy can help route feedback instantly to the right team for faster resolution.
Best practices for scaling a route-feedback program

Creating a repeatable feedback workflow
A strong feedback workflow makes delivery feedback by route usable, not just visible. Build a simple, repeatable delivery feedback process across markets and partners:
- Collect consistently: Use the same survey fields, route IDs, partner tags, and issue categories after every delivery.
- Review on a set cadence: Check route-level trends daily for urgent issues and weekly for patterns.
- Escalate by rule: Trigger alerts for low scores, damaged orders, late deliveries, or repeat route complaints.
- Act and close the loop: Assign owners, track fixes, and measure whether your route feedback program reduces repeat friction.
Avoiding common measurement mistakes
To make delivery feedback by route reliable, avoid these common delivery measurement mistakes:
- Watch for customer feedback bias: Low response rates can skew results toward very happy or very unhappy customers. Improve participation with fast, in-the-moment prompts.
- Don’t rely on averages alone: Mean scores can hide repeated failures on specific routes or time windows.
- Add operational context: Review feedback alongside delay reasons, driver changes, weather, and order complexity.
- Use route segmentation: Compare by distance, density, urban vs. rural, time slot, and delivery partner to spot real friction patterns.
What success looks like over time
Track delivery feedback by route monthly to confirm whether fixes are creating lasting gains, not just short-term wins. Look for:
- Higher customer satisfaction metrics, including route-level ratings, repeat orders, and positive comments
- Fewer complaints about delays, missing items, damaged goods, or poor handoffs
- Better on-time performance and tighter consistency across drivers, zones, and time windows
- Clear operational friction reduction, such as fewer escalations, reroutes, and service recovery cases
This approach turns route insights into measurable delivery performance improvement across the network.
Conclusion
In home delivery, the biggest operational problems rarely appear in aggregate reports first—they show up on specific routes, in specific time windows, and through repeated customer complaints. That’s why delivery feedback by route is so valuable. It helps teams move beyond surface-level satisfaction scores to pinpoint where delays, damaged orders, communication gaps, driver handoff issues, or fulfillment errors are actually happening.
By analyzing feedback at the route level, businesses can identify patterns faster, separate one-off incidents from systemic friction, and make smarter decisions about staffing, training, routing, and service recovery. Just as importantly, delivery feedback by route gives customer experience and operations teams a shared view of what’s working, what isn’t, and where improvements will have the greatest impact.
The next step is to build a consistent feedback loop: collect post-delivery input while the experience is fresh, categorize issues clearly, and route alerts to the right teams for quick action. From there, review route-level trends regularly and use the findings to refine delivery processes over time.
If you’re ready to turn customer insight into operational improvement, start by auditing your current feedback collection process and identifying gaps in route visibility. Tools like Tapsy can help capture real-time post-delivery feedback and surface recurring issues faster, so you can reduce friction, recover problems quickly, and deliver a better experience on every route.
Frequently Asked Questions
- What does delivery feedback by route mean?
Delivery feedback by route ties customer responses to the specific route, stop sequence, driver run, or delivery window that served them. This makes it easier to see where problems actually happen instead of relying on one blended satisfaction score.
- Why is route-level feedback more useful than general post-delivery surveys?
General surveys show what customers felt, but they often do not show where the issue occurred. Route-level feedback connects complaints and praise to a route, territory, or time slot so teams can fix specific operational causes faster.
- What kinds of operational friction can route feedback reveal?
It can uncover repeated late arrivals, missed windows, poor communication, damaged goods, difficult handoffs, and driver-specific execution issues. Grouping feedback by route helps teams spot patterns that single-order reviews often hide.
- How does route performance affect customer experience in home delivery?
Customers usually judge the full brand experience through the delivery itself. When routes run late, miss windows, or produce damaged orders, complaints, refund requests, and support costs tend to rise while trust and repeat purchases can fall.
- What planning problems commonly show up in route-level delivery feedback?
Recurring issues often trace back to unrealistic stop counts, tight time windows, overloaded schedules, and poorly designed territories. These planning problems can create predictable delays, rushed handoffs, and failed deliveries.
- How can teams identify communication gaps during the delivery journey?
Track route feedback alongside notification timing, ETA performance, and arrival-message clarity. Repeated complaints about missing updates, inaccurate ETAs, or vague alerts usually point to a process gap rather than an isolated mistake.
- What driver execution issues should be monitored at the route level?
Teams should watch professionalism, proof-of-delivery quality, package handling, and whether special instructions or contactless promises were followed. Route-level patterns help separate network-wide issues from coaching or staffing needs.
- Which feedback channels work best for collecting route-specific delivery insights?
Useful channels include SMS surveys, email follow-ups, app prompts, call center logs, and support tickets. SMS and app prompts are especially helpful right after delivery because the experience is still fresh and response friction is low.
- What information should be attached to each feedback response?
Each response should include route ID, delivery stop ID, driver or crew ID, promised time window, actual delivery timestamp, and service type. Consistent identifiers make it possible to compare routes accurately and spot repeat friction.
- Why should qualitative comments be combined with operational metrics?
Customer comments become more actionable when matched with on-time delivery, failed delivery rate, dwell time, and driver-customer contact rate. This helps teams distinguish isolated complaints from route-level patterns with measurable operational causes.
- How can teams tell the difference between a one-off complaint and a systemic route issue?
Check how often the same complaint appears on a route, stop cluster, driver shift, or time window, and compare it with route metrics like lateness, failed drops, reroutes, or proof-of-delivery gaps. Repeated signals over multiple days or teams usually indicate a broader process, training, or routing problem.
- What should a route-level feedback dashboard include?
A strong dashboard should show route summaries, exception views, time and geography comparisons, and recovery tracking. Key measures include CSAT or NPS by route, first-attempt success rate, on-time delivery percentage, issue rate per 100 deliveries, and refund or redelivery rate.
- How can route feedback be turned into operational improvements?
Teams can adjust stop sequencing, update traffic assumptions, rebalance territories, refine time windows, and align service promises with actual route performance. Route-level feedback also supports targeted coaching for drivers and dispatch teams using specific customer comments and recurring issue patterns.
- What are the best practices for scaling a route-feedback program?
Use a repeatable workflow: collect feedback consistently, review route trends on a set cadence, escalate based on clear rules, and assign owners to close the loop. Standard survey fields, route IDs, partner tags, and issue categories help keep the process usable across markets and partners.
- What measurement mistakes should be avoided when analyzing delivery feedback by route?
Do not rely only on averages, because mean scores can hide repeated failures on specific routes or time windows. It is also important to account for response bias and review feedback with operational context such as delay reasons, driver changes, weather, order complexity, and route segmentation.